Are companies too obsessed with growth? How to measure habits
This post initially appeared at NirAndFar.com
Imagine that an entrepreneur showed you this graph for his new app, PinterestForDogs.
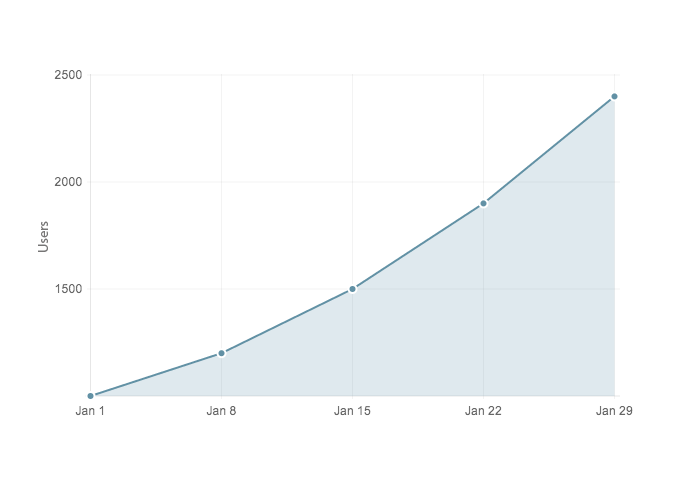
You would think PinterestForDogs is doing quite well, right? Well, it depends.
A common mistake entrepreneurs make is to focus too much on user growth. Often, it is more important to ask: “Is the product creating a habit so users keep coming back?”, “How do we measure the strength of such a habit?” These are crucial because without an established user habit, it is impossible to sustain a healthy user base. Eventually, all user acquisition channels saturate. If the users do not keep coming back, the result is a hollowing out effect. It looks like a ring of fire expanding outwards. The fire burns out everything inside and the only activity that survives is at the edges.

I learned this the hard way with our first product. This was a walkie-talkie app called blip.me in which a user could record a short audio clip and send it to a friend. We saw good viral growth as users invited others. User retention, however, was not so great; people would be very excited initially but within a few weeks they would drop off. The end result was an app that was downloaded by millions but used by few.
Given the importance of establishing a user habit, how do we track it? In my experience, the best way to do this is by measuring retention rate through cohort analysis. Let us define these terms.
Cohort Analysis
-
A cohort is a group of people who share a particular characteristic over a period of time. An example is a group of users who joined on a particular day.
A cohort analysis follows these users actions over a period of time.
Retention Rate
-
The retention rate of a cohort for a period of time is the ratio of number of active users at the end of the period to the number of active users at the start of the period. The definition of an active user is usually very specific to the product. For our purposes, a user is active on a given day if he or she has visited the product on that day.
Continuing with our running example, PinterestForDogs, we will measure the retention rate for two cohorts of 100 users, one cohort consisting of users who joined on January 1 and another who joined a week later on January 8.
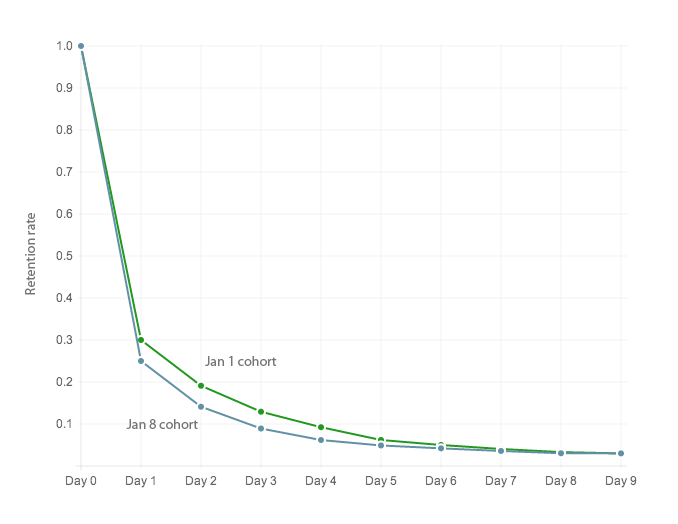
As you can see from the above example, the retention rate decays with time. The graph starts flattening and eventually plateaus. Although, the January 1 cohort seems to be retaining slightly better, we see that both cohorts experience a sharp drop off and settle to a retention rate of 0.03 (3%). This final level consists of users that have become hooked: they have established a habit pattern to keep coming back to the product. These are your most interesting users.
Analytics platforms such as Mixpanel and KissMetrics offer cohort analysis capabilities. There are also more specialized solutions such as RJMetrics.
How is cohort analysis helpful?
-
Critical data does not get drowned by external events. If you are just looking at the user growth, a mention by a blog may cause a huge spike in the user sign-ups but any pre-existing cohorts are not affected much.
-
Cohorts give you actionable data. Why is the user retention weak? Could it be the onboarding? Do you need reminders to establish a consumption habit? By watching the cohort closely, you can get a good idea of what is going on in user’s mind.
-
You can compare cohorts. A common comparison is cohorts of users who joined at different times. If one cohort is doing better or worse than another, you can ask why.
-
Cohort analysis naturally leads you to an intense focus on the consumer. If you are looking at a cohort of 100 users, these are actual live users. As you worry about this cohort, you start putting yourself in the user shoes.
-
Keeps you honest. It is easy to drink your own kool-aid when you are experiencing heady user growth. Keeping a close eye on cohorts forces you to continue asking the right questions.
What retention rate numbers should you expect?
Naturally, the retention rates vary by the industry. An e-commerce application that is able to monetize users well can probably live with much lower retention rate than a free social networking app that needs millions of active users to be interesting. The following numbers are tailored to mobile or web apps in the social networking/sharing space.
The number that I focus on is the retention rate once it reaches a plateau (In our space, 4 weeks after the cohort join date should be enough time for this). If this number is more than 20%, congratulations, you are doing great. To compare yourself against two successful companies in this space: Twitter and Pinterest, you can look at the analysis by RJMetrics (reproduced with permission below).
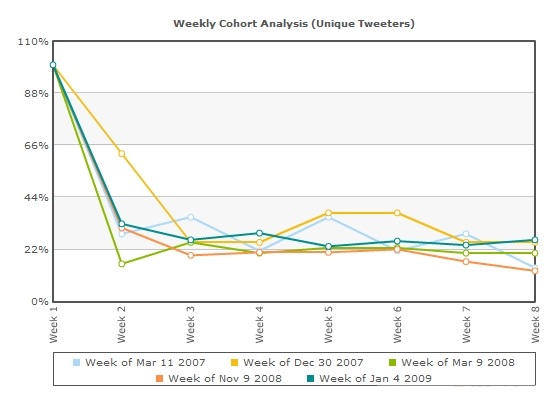
The graph above analyzes cohorts in time intervals of weeks instead of days and an active user is someone who has published at least once a week. We can see that by this measure, the retention rate for Twitter was plateauing around 22%.
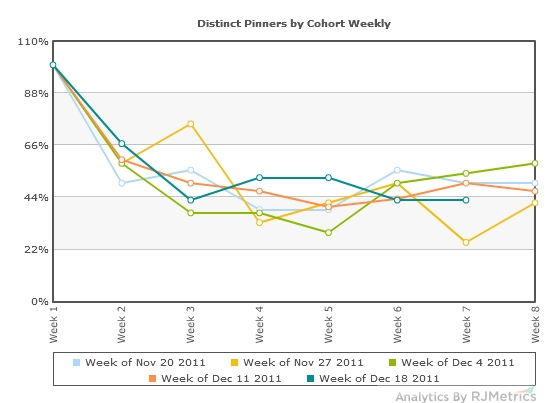
On the other hand, the retention rate for Pinterest settles to an astonishing 45%!
If your cohorts are retaining less than 5% of users after 4 weeks, the product has not been able to establish a good user habit. You should take a hard look at the product. Is it something that users really want? Are your users getting confused? If we look at the plateau retention rate of our example, PinterestForDogs, we see that it is only 3%. This implies that it is unlikely to succeed, even though the first graph of user growth looked great.
Cohort analysis asks tough questions. But, the sooner you ask them the better your startup will be.
Estimating your competitor’s retention
Given how crucial retention is, would it not be awesome if you could estimate that of a competitor, or a company that you are researching? If there is any public user activity that is available, you can approximate a cohort analysis by selecting a random set of users and then following their public activity with time. The difficulty here is making sure your sample is not biased in any way. But even imperfect data is better than no data. One quick check that I have done in the past is to pick a few users from recent posts or likes and follow their activity from the point they registered. If most such users drop off soon after registration, that is a sure indication of poor retention. This is not a very rigorous analysis but often gives useful data.
Summing up
To succeed, a product has to create a lasting habit so that users keep coming back. Without such a habit, even if there is good user aquisition, it is hard to establish a growing base of active users. Simple metrics such as retention rate applied on cohorts of new users are valuable in figuring out the strength of the habit. Cohort analysis also lead to valuable questions and insights that are crucial for the success of the product.
Discuss on Hacker News
Many thanks for Nir Eyal, David King, Tim Courrejou, and Sameer Shariff for comments on earlier drafts of this post.